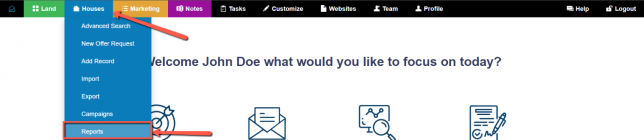
We have a few key reports built into the Investment Dominator regarding your land investment deal flow, located under the ‘House > Reports‘ section.
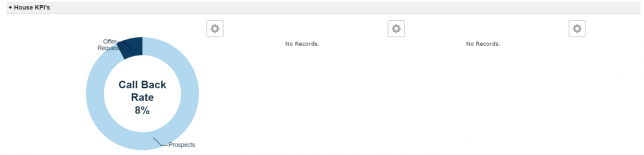
House KPI’s
This report will give you the Call Back Rate, Offer Acceptance Rate and Profits.
- Call Back Rate: This percentage is the Offer Requests you have recieved in regards to total Leads in your system.
- Offer Acceptance Rate: This percentage is the Offers Accepted in regards to Offers Sent
- Profit: This is the total Sold Amount minus Purchased Amount. It is also discounting Total Closing Costs in both values.
You can also customize these reports, so you can add or remove other Status(es) to each of these.
House Deal Summary
Total Invested (House)
This is the amount you have spent and recorded in the system to purchase houses.
Total Asset Value (House)
This is the total amount value based on the Market Values entered in the system for the property you own.
Total Revenue Generated (House)
This is the amount of revenue you have generated by selling houses based on the recorded sale price saved in the system.
Total Profit (House)
This is the total profit generated from house sales based on data entered into the system under the ‘Transaction Information‘ section of your property records.
Average Deal Life Cycle (In Days) (House)
This is how long on average does it take to buy and sell a property according to data entered into the system.
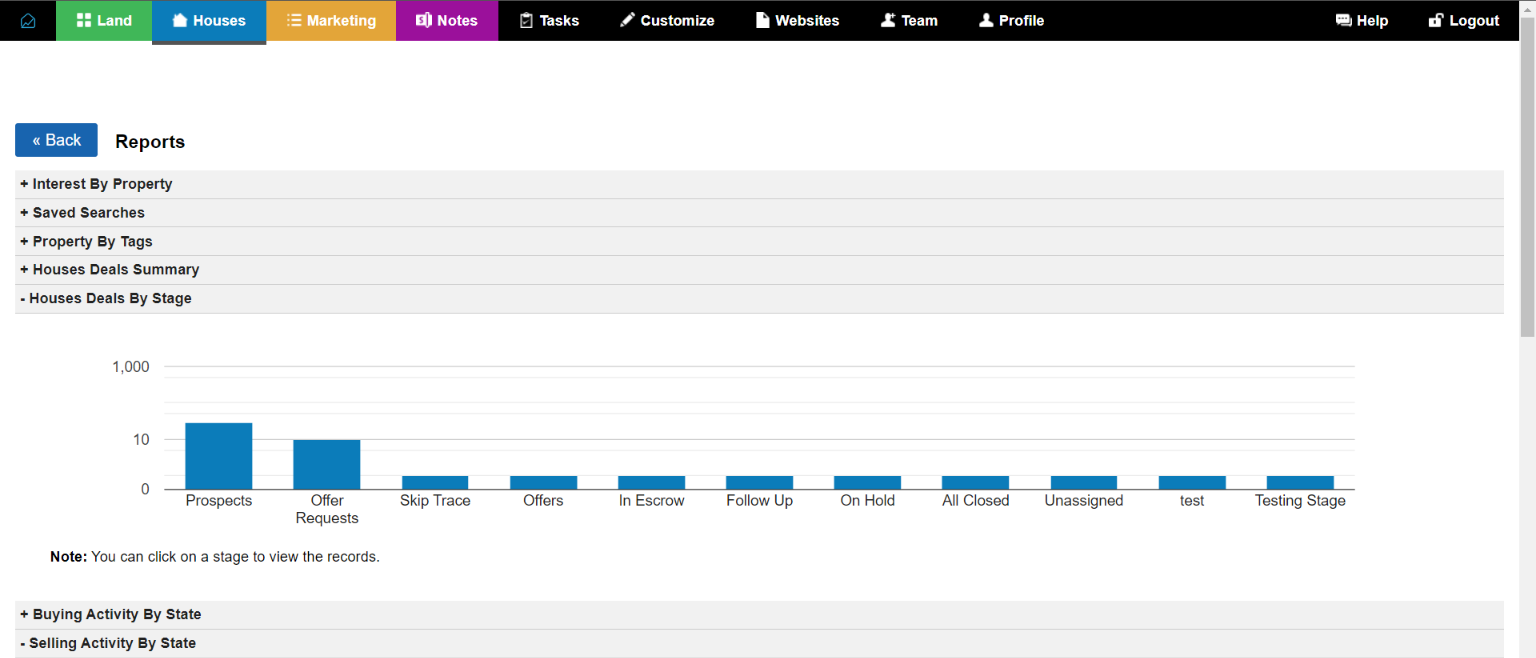
House Deal By Stage
Your deal flow is organized by Stages in the system. You can view a count of properties in each Stage of your deal flow so that you can identify bottlenecks quickly.
Hover over a column to view the number of properties within that Stage and click the column to load the list of properties within that Stage
Interest By Property
This report will show you the number of people interested in a particular property based on how many people are connected to your property under the ‘Interest In‘ field of your Buyers List (‘Marketing‘ tab).
You can click on the number next to the property description to load the actual list of contacts interested in that particular property.
This report shows you what types of properties get more interest than others.
Saved Searches
This is where all of your saved ‘Advanced Searches‘ are displayed. For more information on how to create an ‘Advanced Saved Search‘ please review this article: https://user-guide.investmentdominator.com/advanced-search-and-saved-searches/
Property By Tags
This report shows the number of records that contain a particular tag. This is useful when segmenting your list by tags.
Click the number next to the Tag name to load the specific list of properties that contain that Tag.
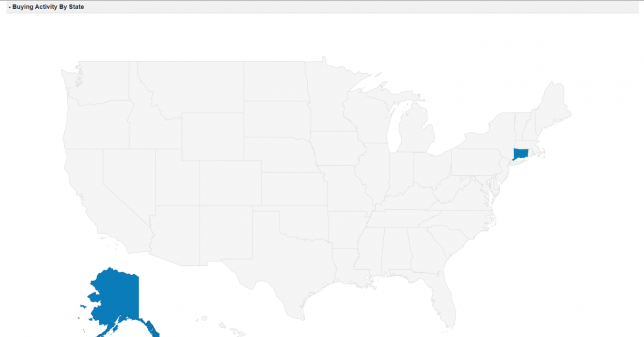
Buying Activity By State
In this interactive map, you can visually see how many Houses you have bought in each State.
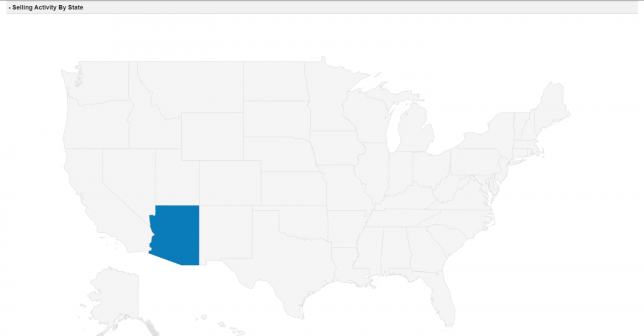
Selling Activity By State
In this interactive map, you can visually see how many Houses you have sold in each State.